Technology Center Overview
Technology Center Overview
For more than 25 years, the CCC Technology Center has been dedicated to transformative innovation in support of the students and staff of the California Community Colleges in collaboration with the CCC Chancellor’s Office.
Adopt Technology Center Products

Adopt Technology Center Products
Supported by the Chancellor's Office, the Technology Center provides California community colleges with a suite of no-cost software solutions and deployment services geared toward improving student outcomes, increasing college efficiency, and strengthening the CCC as a whole.
Technology Support for CCC Staff & Faculty Carousel

Technology Support for CCC Staff & Faculty
California Community Colleges staff and faculty using systemwide technology applications can find technical support resources and materials through CCCTechnology.info. The site is monitored by Tech Center support technicians and subject matter experts, providing 24/7, on-demand help and self-service support.
Tech Center Highlights
We bring systemwide enabling technologies to our colleges.
Adopt Our Tech
From connectivity to student services and educational technology.
Connecting Colleges
Gigabit fiber optic network for all of our colleges.
Information Security
Logging, monitoring, and no-cost tools to protect students and educators.
Accessibility
Training and resources to make tech accessible to users with disabilities.
Events
Upcoming CCC Technology Center workshops and webinars.
About the Technology Center
The California Community Colleges Technology Center, hosted by Butte College, facilitates and coordinates the work of systemwide technology. Our 25-year history of collaboration with the Chancellor’s Office and community colleges throughout the state has resulted in great strides forward for the system in areas including federated identity, application architecture, networking, and student services.
We operate under the Gartner model of “Run, Grow, Transform” to simplify our portfolio of services and prioritize resources in support of ongoing operations, the next phase of growth, and longer term transformative innovation.
Resource Kit
Top Stories
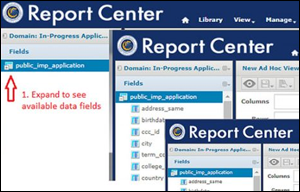
CCCApply In-Progress Applications Report
At a time when community colleges are seeing lower enrollment, data from CCCApply applications that were started but not submitted can inform a more tailored outreach or assistance to prospective students. Learn More

System Use of the CCCID
While the CCCID provides students with a secure, single sign-on to various cloud-based applications, it is also an effective tool for colleges, districts, and the Chancellor’s Office to track students’ non-linear journeys which often span multiple colleges. Learn More

Tech Center, SDCCD: CENIC 2024 Innovations in Networking Award
Award recognizes San Diego Community College District's project to move its ERP to Oracle Cloud Infrastructure, ensuring a more efficient, scalable, and secure management of resources. The project was supported by the CCC Technology Center and CENIC. Learn more